Syce Overview
Syce is a real-time terminal UI (TUI) for monitoring Horsies workers, tasks, and workflows. Built in Rust with ratatui, it connects directly to the Horsies PostgreSQL database and renders live cluster state in the terminal.
Installation
Section titled “Installation”From crates.io
Section titled “From crates.io”cargo install syceFrom source
Section titled “From source”cd sycecargo build --releaseThe binary is at target/release/syce.
Configuration
Section titled “Configuration”Syce needs the same PostgreSQL database URL used by Horsies workers.
Environment variable
Section titled “Environment variable”export DATABASE_URL="postgresql://user:pass@localhost:5432/mydb"syceCLI argument
Section titled “CLI argument”syce --database-url "postgresql://user:pass@localhost:5432/mydb"PgBouncer / Transaction Pooling
Section titled “PgBouncer / Transaction Pooling”When monitoring a deployment that uses transaction-pooled PgBouncer, point Syce’s query pool at the pooled URL and its listener at the direct/session URL:
syce \ --database-url "$DATABASE_URL_POOLED" \ --session-database-url "$DATABASE_URL_DIRECT" \ --pgbouncer-transaction-modeManaged providers, such as PlanetScale Postgres, may show separate pooled and direct connection strings. Verify the current ports and URLs in your provider dashboard or docs. Without a session-capable listener URL, Syce can still refresh by polling, but real-time notifications will show as disconnected or reconnecting.
.env file
Section titled “.env file”DATABASE_URL="postgresql://user:pass@localhost:5432/mydb"CLI Options
Section titled “CLI Options”| Flag | Default | Description |
|---|---|---|
--database-url, -d |
$DATABASE_URL |
PostgreSQL connection string |
--session-database-url |
$HORSIES_SESSION_DATABASE_URL |
Direct/session-capable URL for LISTEN/NOTIFY |
--pgbouncer-transaction-mode |
$HORSIES_PGBOUNCER_TRANSACTION_MODE |
Disable SQLx statement cache for transaction-pooled PgBouncer |
--tick-rate, -t |
4.0 |
Data refresh rate (ticks per second) |
--frame-rate, -f |
60.0 |
UI render rate (frames per second) |
Syce organizes monitoring into five tabs, accessible via number keys 1-5.
1 - Dashboard
Section titled “1 - Dashboard”Cluster-level overview:
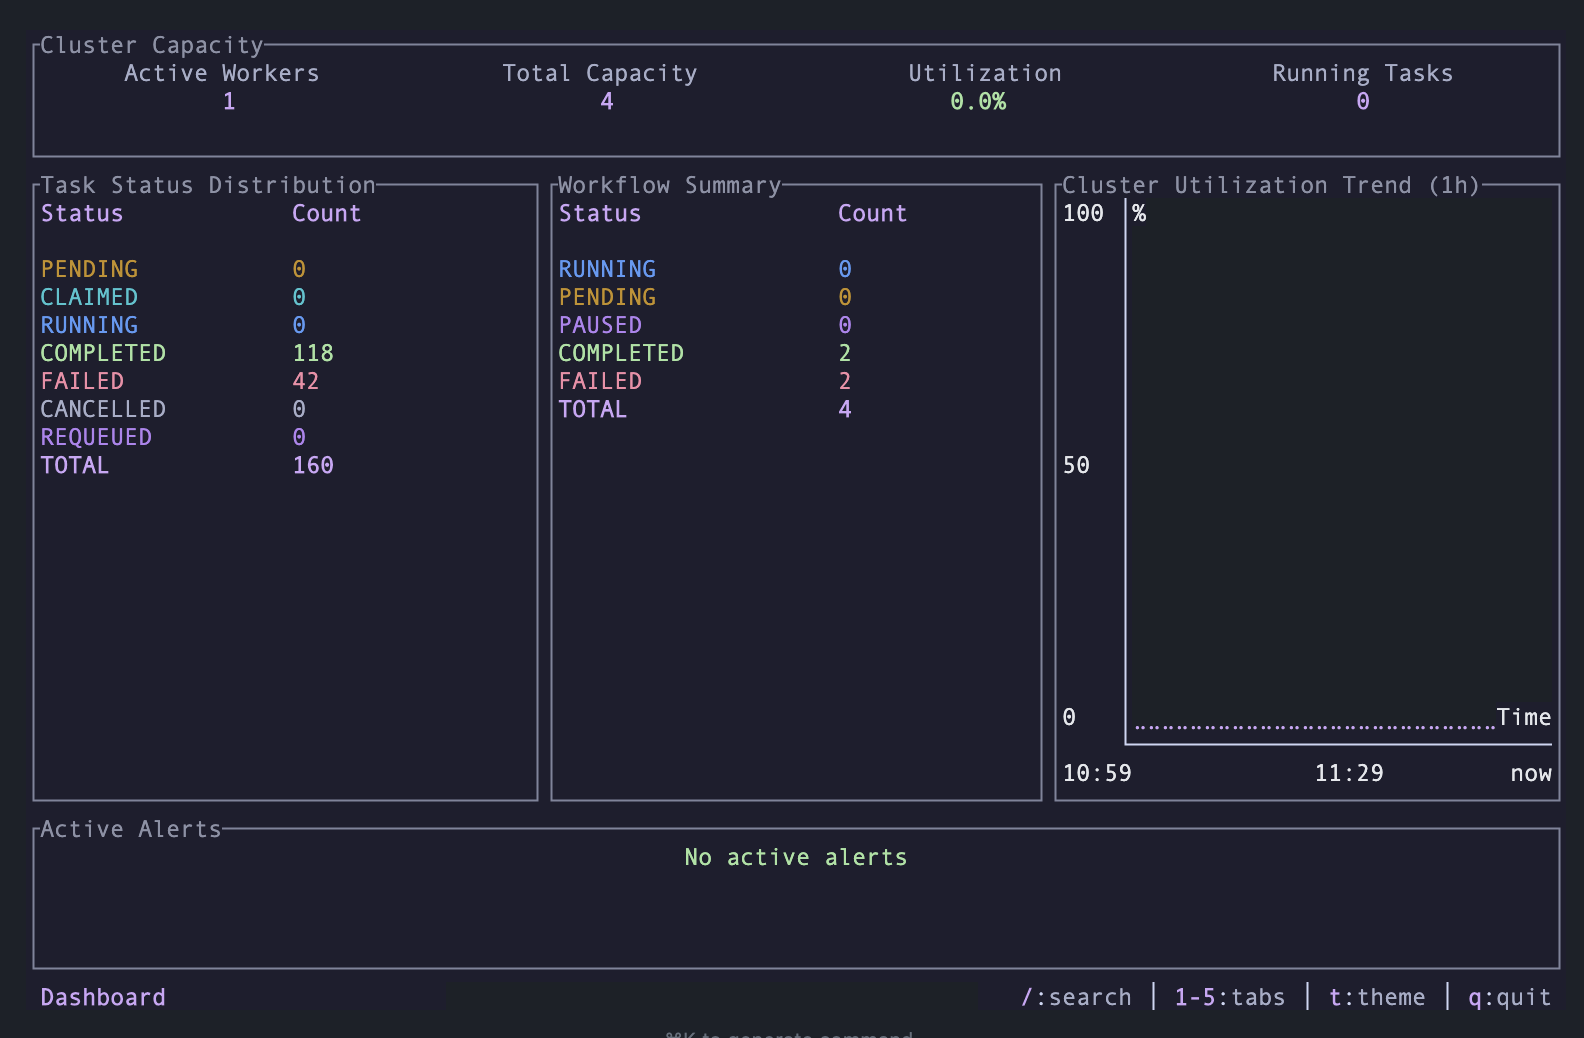
- Cluster Capacity — Active workers, total capacity, utilization percentage, running tasks
- Task Status Distribution — Breakdown by status (Pending, Claimed, Running, Completed, Failed)
- Workflow Summary — Workflow counts by status
- Utilization Trend — Braille line chart of cluster utilization over the past hour
- Active Alerts — Overloaded workers and stale claim warnings
2 - Workers
Section titled “2 - Workers”Per-worker monitoring:
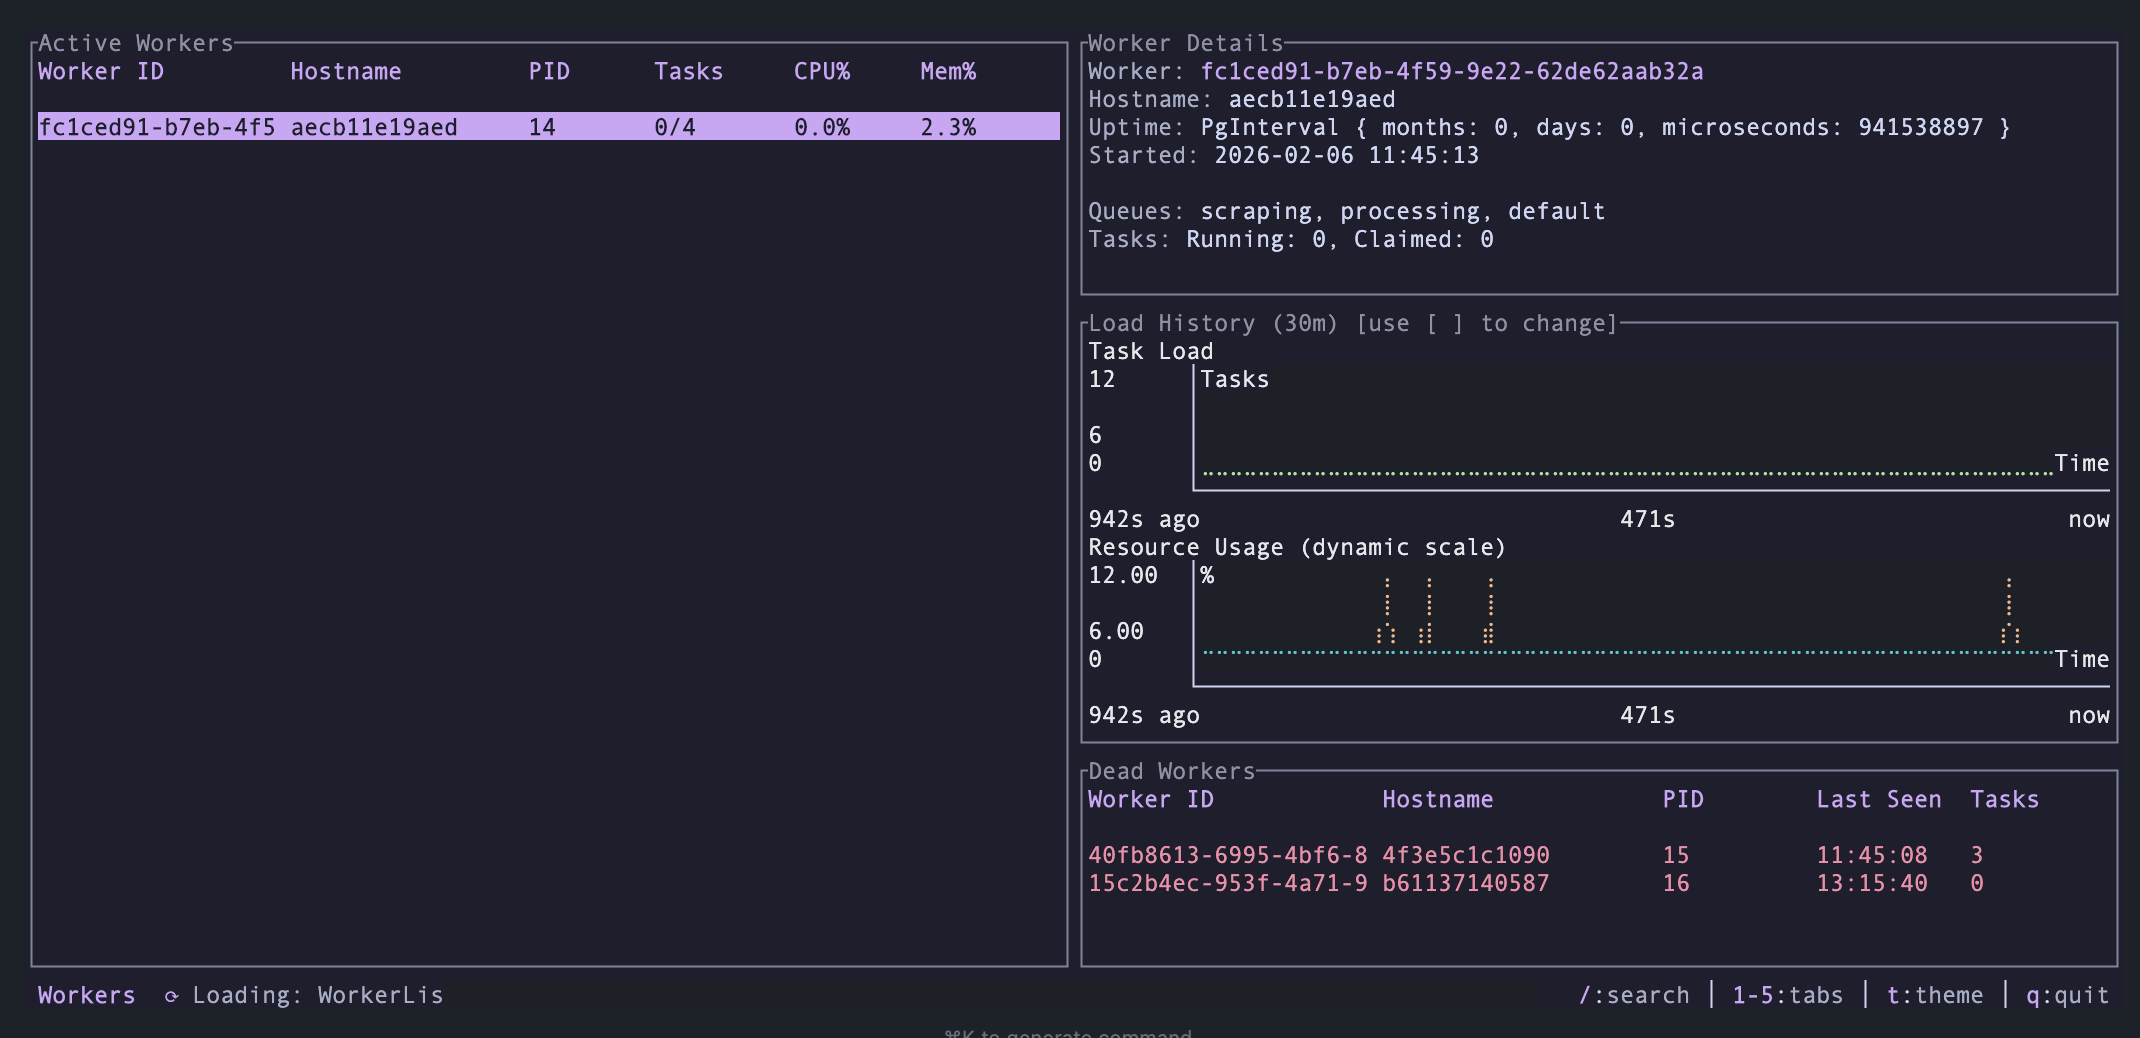
- Worker list with hostname, PID, process count, running/claimed tasks, CPU/memory usage, uptime
- Select a worker to see detailed metrics and load charts
- Adjustable time window for charts: 5m, 30m, 1h, 6h, 24h
3 - Tasks
Section titled “3 - Tasks”Task distribution and inspection:
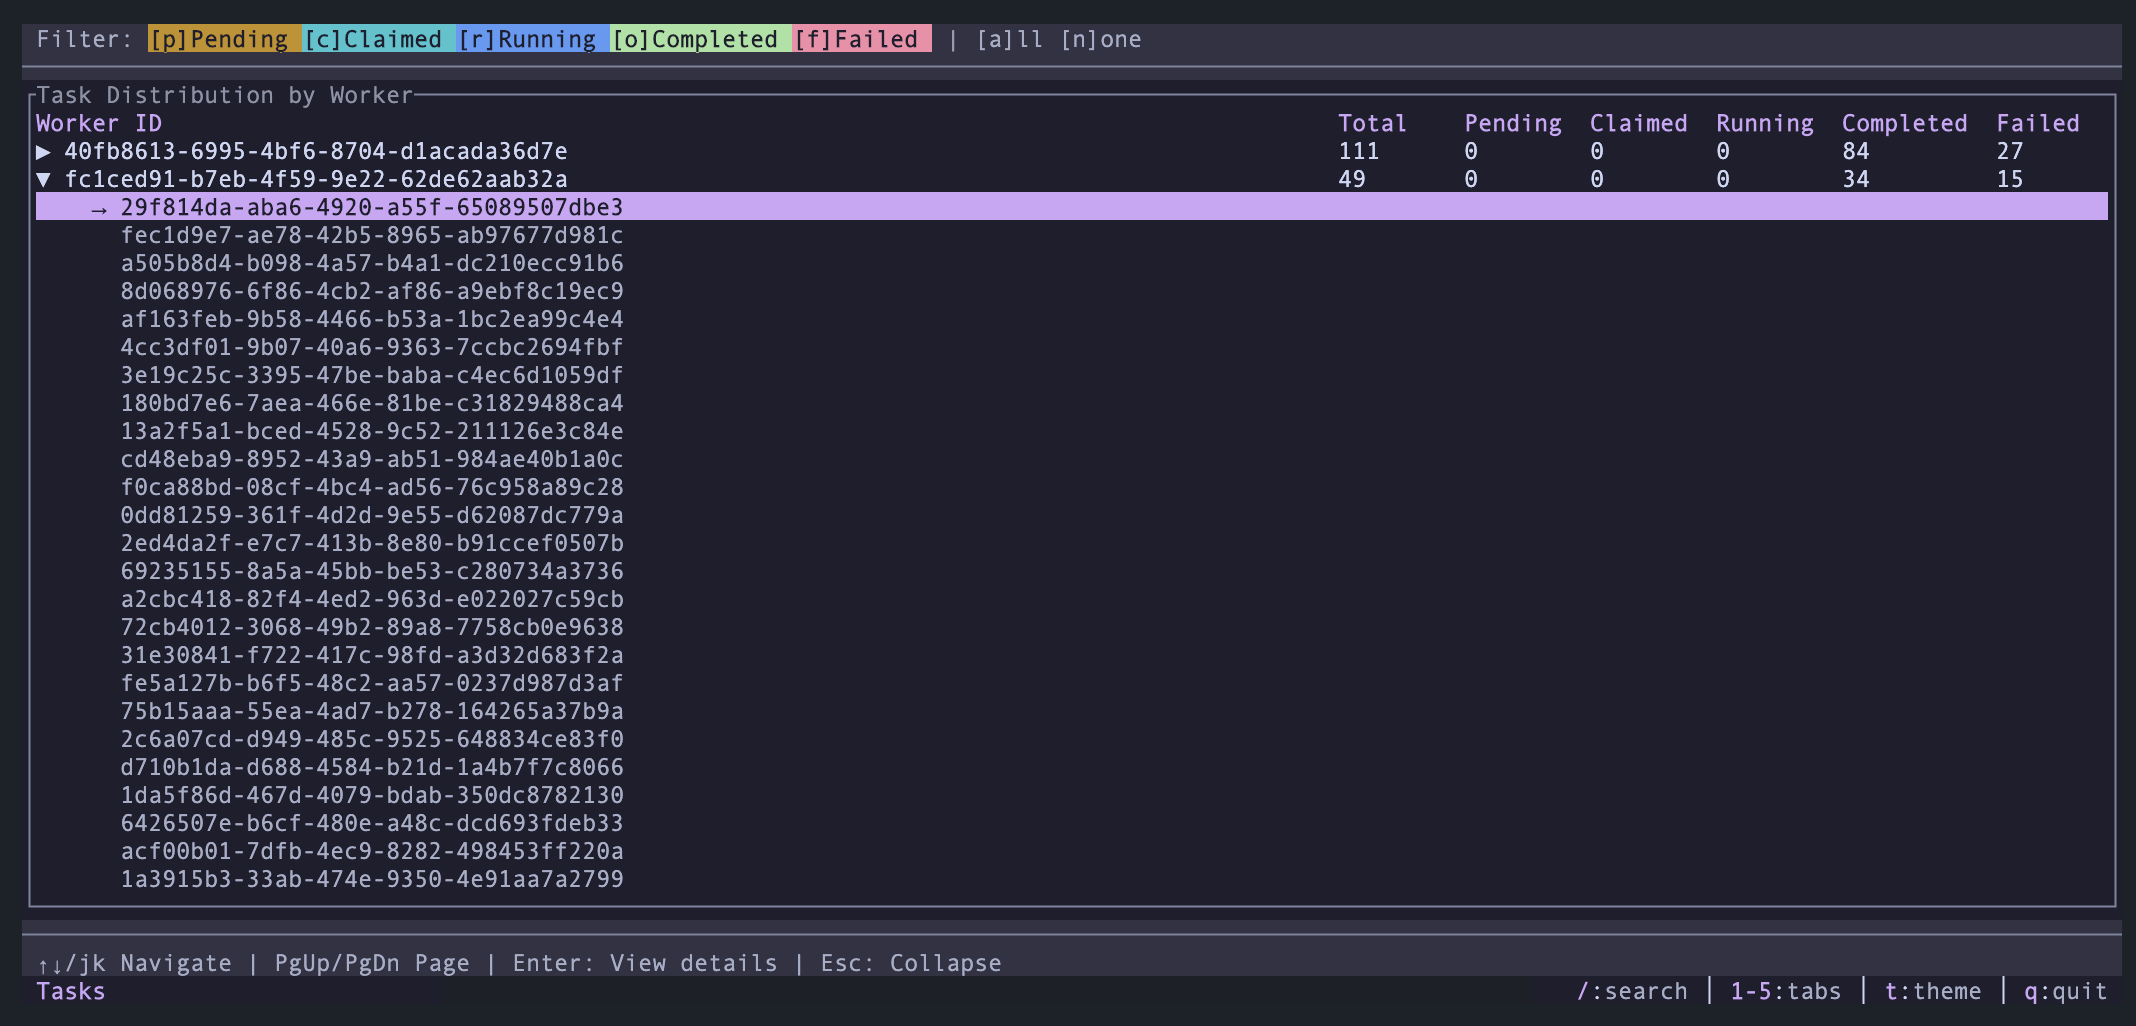
- Aggregated task breakdown by worker
- Status filters (Pending, Claimed, Running, Completed, Failed)
- Expand a worker row to see individual task IDs
- Task detail modal with full JSON payload
- Copy task data to clipboard
4 - Workflows
Section titled “4 - Workflows”Workflow tracking:
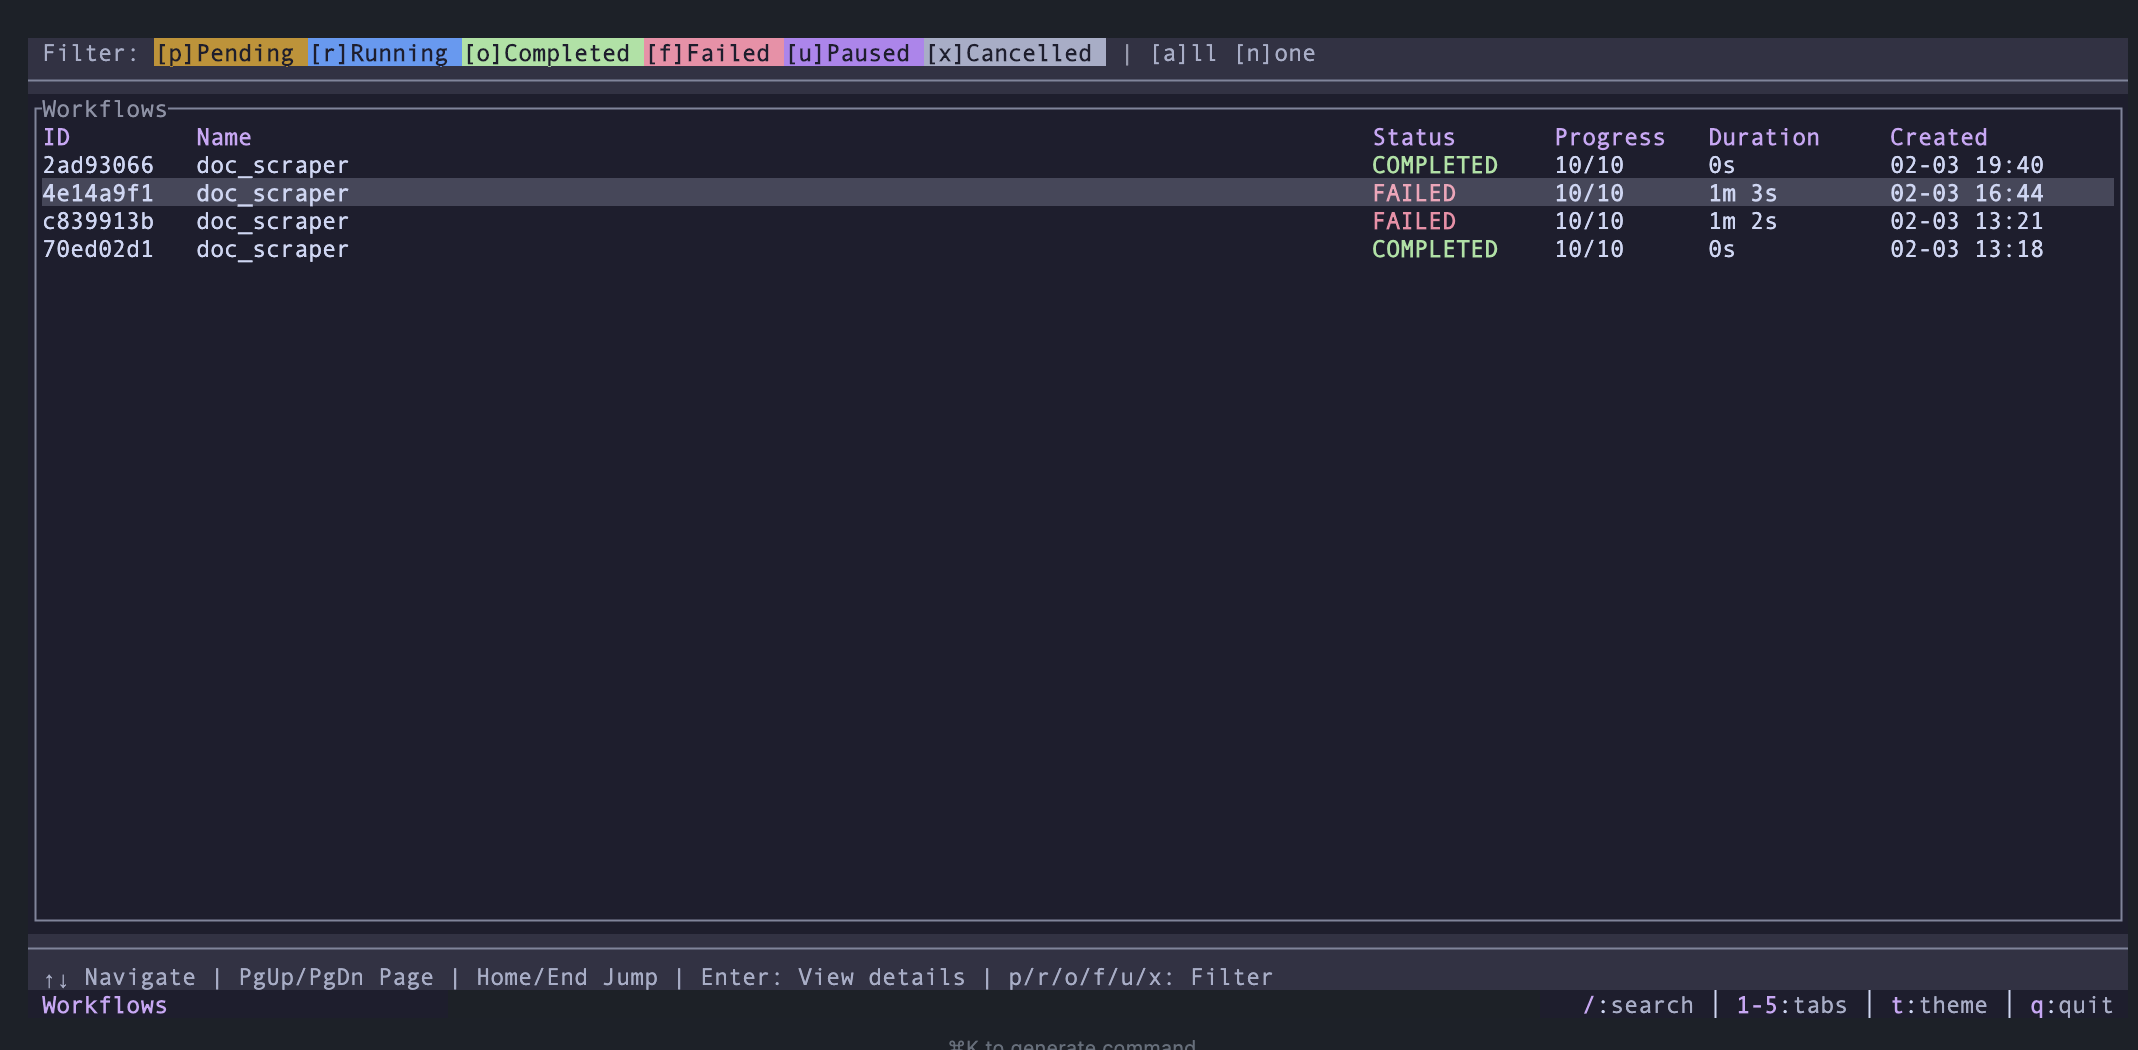
- Workflow list with ID, name, status, task count, progress
- Status filters (Pending, Running, Completed, Failed, Paused, Cancelled)
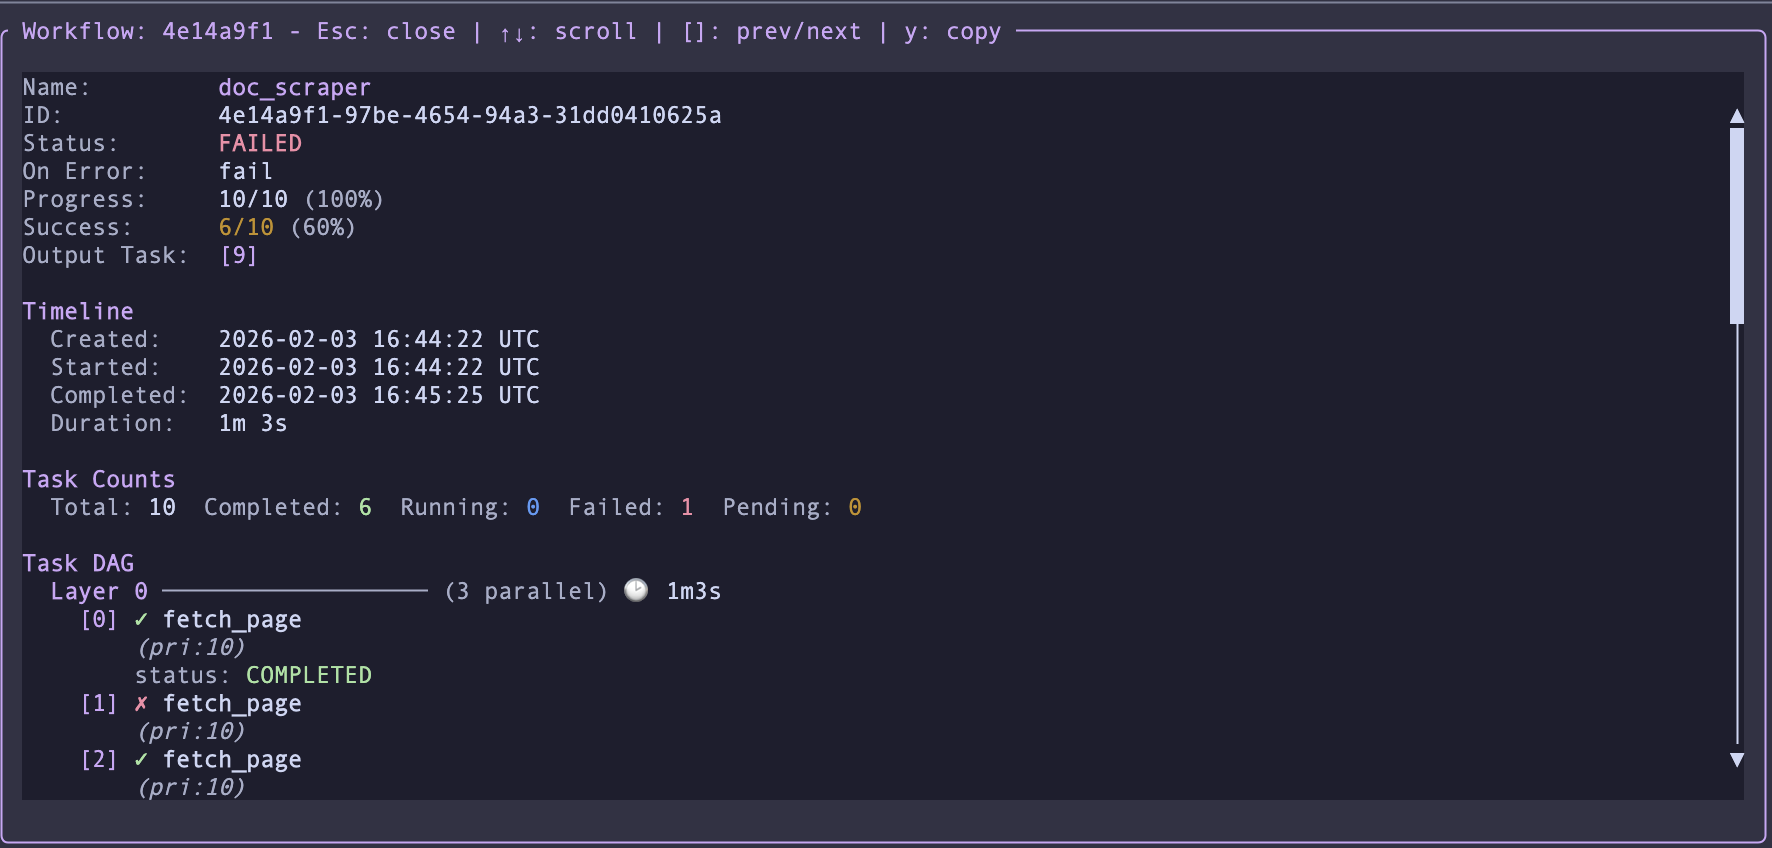
- Workflow detail modal showing constituent tasks and their states
- Copy workflow data to clipboard
5 - Maintenance
Section titled “5 - Maintenance”Operational health:
- Snapshot age distribution (histogram of worker state freshness)
- Dead worker detection
Keyboard Shortcuts
Section titled “Keyboard Shortcuts”Global
Section titled “Global”| Key | Action |
|---|---|
1-5 |
Switch tab |
/ |
Search (context-aware) |
? |
Toggle help overlay |
r |
Refresh current tab |
t |
Cycle theme |
q, Esc |
Quit |
Ctrl+z |
Suspend to background |
Workers Tab
Section titled “Workers Tab”| Key | Action |
|---|---|
Up/Down |
Select worker |
[, ] |
Cycle time window (5m / 30m / 1h / 6h / 24h) |
Tasks Tab
Section titled “Tasks Tab”| Key | Action |
|---|---|
Up/Down |
Navigate workers / task IDs |
Enter |
Expand row / open task detail |
Esc |
Collapse expanded row |
y |
Copy task JSON to clipboard (in detail view) |
Status Filters
Section titled “Status Filters”| Key | Action |
|---|---|
p |
Toggle Pending |
c |
Toggle Claimed |
u |
Toggle Running |
o |
Toggle Completed |
f |
Toggle Failed |
a |
Select all statuses |
n |
Clear all statuses |
Workflows Tab
Section titled “Workflows Tab”| Key | Action |
|---|---|
Up/Down |
Navigate workflows |
Enter |
Open workflow detail |
Esc |
Close detail |
y |
Copy workflow JSON to clipboard |
Theming
Section titled “Theming”Syce ships with Catppuccin color themes. Press t to cycle through available flavors (Latte, Frappe, Macchiato, Mocha) with automatic light/dark detection.
Data Sources
Section titled “Data Sources”Syce reads from the same PostgreSQL tables Horsies workers write to:
| Table | Purpose |
|---|---|
horsies_worker_states |
Worker state snapshots (captured every worker_state_snapshot_interval_ms, default 30s) |
horsies_tasks |
Task records with status, arguments, results |
horsies_heartbeats |
Task liveness heartbeats |
horsies_workflows |
Workflow definitions and status |